The authors evaluated end-to-end approaches based on you-only-look-once (Yolo)V5 and YoloV7, and a two-stage approach using an ensemble of classifiers. The YoloV7-based approach achieved the best performance, providing a reliable tool for farmers to monitor loser fish abundance. The researchers also offered a dataset of annotated salmon images for further research.
In recent years, the global aquaculture industry has faced challenges in reducing mortality rates and improving fish welfare, particularly in the production of salmonids, which exceeded 3.5 million tons in 2020. Among these challenges is the phenomenon of "loser fish syndrome," where certain individuals fail to thrive and exhibit signs of emaciation and poor health, posing significant welfare concerns.
While this issue has been recognized and termed differently, including "moribund" and "drop-outs," systematic monitoring and understanding of its underlying causes remain limited. The lack of a robust monitoring system has hindered efforts to correlate the occurrence of loser fish with environmental factors and production conditions.
Existing methodologies for fish monitoring, such as manual observation or basic camera systems, are labor-intensive and inefficient for large-scale operations. Computer vision technology has emerged as a promising solution, offering automated fish detection and classification capabilities. However, previous studies have primarily focused on generic object detection and classification tasks, lacking specific applications for growth-stunted salmon monitoring.
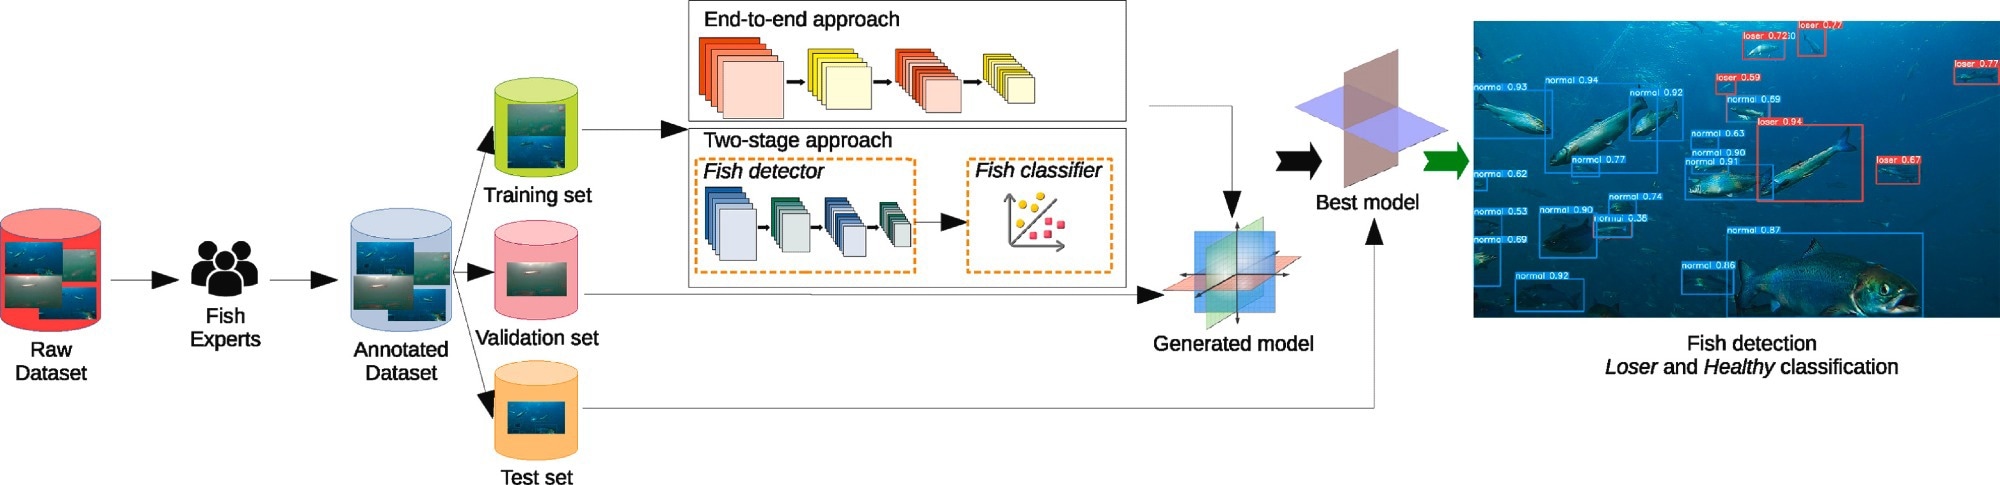
This paper aimed to address these gaps by evaluating and comparing different computer vision pipelines tailored to the detection and classification of loser fish in salmon aquaculture. By testing both end-to-end and two-stage approaches, incorporating Yolo algorithms and ensemble classifiers, the study sought to provide a reliable and efficient solution for monitoring loser fish abundance.
Additionally, by comparing automatic classification results with manual expert classification, the paper aimed to validate the effectiveness of the proposed methodologies in practical aquaculture settings. Through these efforts, this research contributed to the development of a comprehensive monitoring system for improving fish welfare and production outcomes in aquaculture.
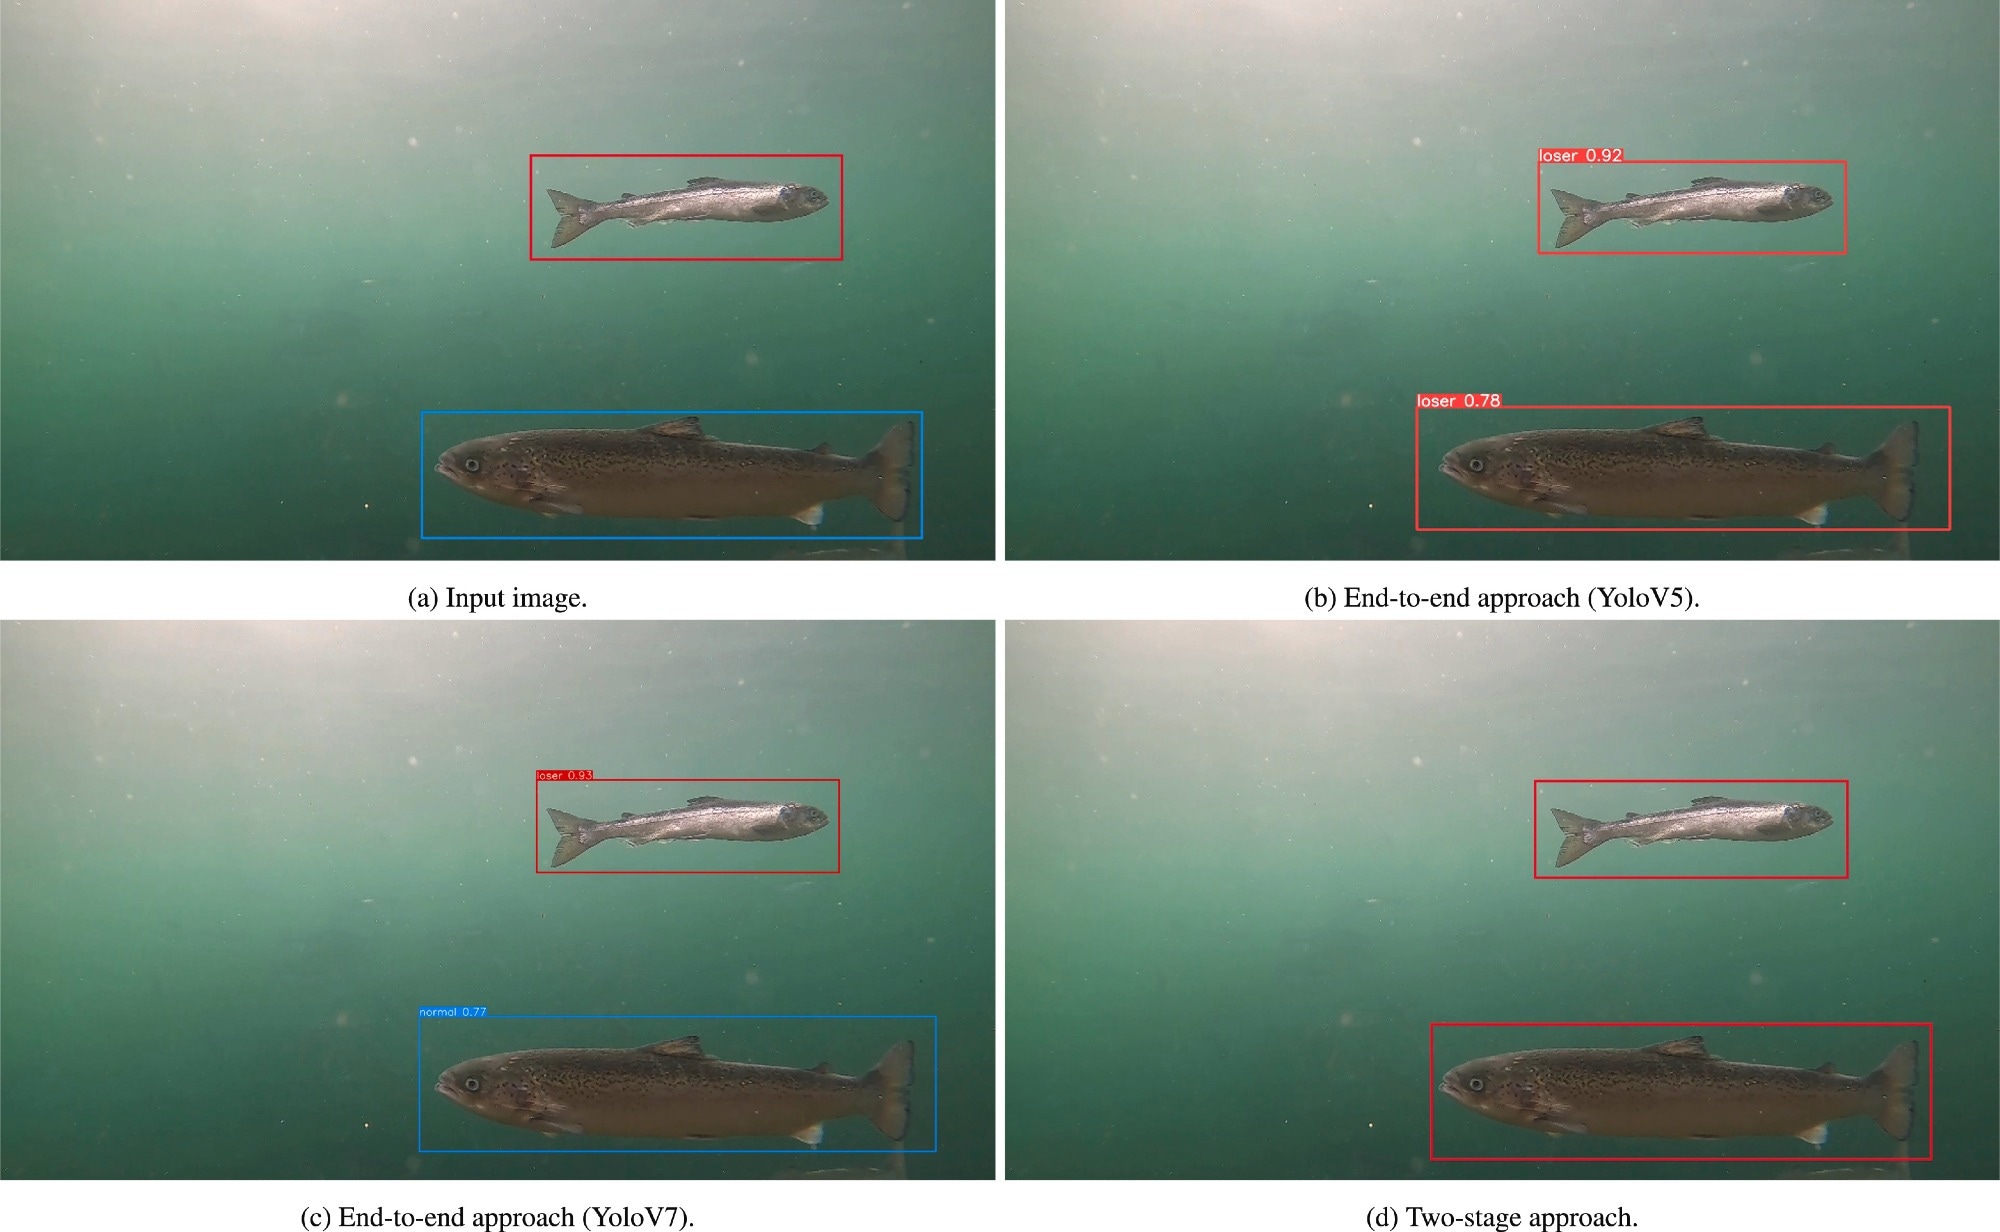 Clear image with few similar fish. Detection and classification results, given the input image (a), for the end-to-end approach (YoloV5) (b), end-to-end approach (YoloV7) (c), and the two-stage approach (d). Blue boxes refer to healthy fish, while red boxes refer to loser fish. (For interpretation of the references to colour in this figure legend, the reader is referred to the web version of this article.)
Methods for Detecting and Classifying Loser Fish
In this study, underwater videos of farmed Atlantic salmon were collected from a fish farm in Norway using GoPro cameras on different days. A total of 257 images were manually extracted from these videos, with 50 images used for variation testing and the remaining 207 images used for dataset creation.
The dataset was divided into training, validation, and test sets, with annotations for healthy and loser fish. Two machine learning approaches, YoloV5 and YoloV7, and a two-stage approach were employed for fish detection and classification. YoloV5 and YoloV7 utilized bounding box regression and achieved real-time detection. The two-stage approach involved transfer learning for fish detection and classification using five different algorithms: linear perceptron, adaptive linear neuron (Adaline), support vector classifier (SVC), k-nearest neighbors (KNN), and multilayer perceptron (MLP).
Ensemble methods combining these algorithms' predictions were also tested. Evaluation metrics such as precision, recall, and F1 score were used to assess the performance of the detection pipelines, with confusion matrices illustrating correct and incorrect classifications. Human reliability in loser fish identification was evaluated through inter-rater and intra-rater reliability tests involving four researchers.
Three researchers agreed on a threshold for classifying loser fish based on existing descriptions and used software for annotation. Fleiss' Kappa was calculated to measure agreement among multiple raters, with 359 classified fish instances considered. The fourth researcher’s identifications were used to assess variability without a consensus threshold. Additionally, one researcher re-evaluated the variation test set after three weeks to measure intra-rater reliability.
Evaluating Detection and Classification Methods for Loser Fish
- End-to-end Approaches: The YoloV5 model exhibited strong performance with a precision of 85.0% for detecting healthy fish and 74.4% for identifying loser fish. Its recall rates were 73.9% for healthy fish and 67.4% for loser fish. Interestingly, among fish detected in the background, 13.0% were classified as losers. In comparison, YoloV7 achieved even higher precision rates, with 88.4% for healthy fish and 84.2% for loser fish. Its recall rates were 72.4% for healthy fish and 71.1% for loser fish. Similar to YoloV5, YoloV7 also detected 14.1% of background fish as losers.
- Two-stage Approach: The two-stage approach’s object detection pipeline found 196 predicted fish, of which 147 matched expert annotations, resulting in an accuracy of 75%. Various classifiers were tested, with the MLP classifier excelling in recall and F1 score, while SVC performed best in precision. The hard voting ensemble, which balanced weights among linear perceptron, MLP, and SVC, emerged as the best two-stage approach. It achieved 79.5% precision for loser fish and 52.6% for healthy fish, highlighting its effectiveness in this classification task.
- Qualitative Analysis: The qualitative analysis revealed that both YoloV5 and YoloV7 effectively detected and classified fish instances, even in challenging conditions such as blurry images or occlusions. The two-stage approach also demonstrated commendable performance, particularly in cases where annotations were incomplete.
- Evaluation of Potential Variations in Manual Image Assessment: Researchers' evaluation of potential variations in manual image assessments showed substantial agreement. Despite minor discrepancies at the image level, the overall Fleiss Kappa value was 0.68, indicating substantial agreement regarding the identification of loser fish.
Conclusion
In conclusion, the researchers developed and evaluated computer vision systems for detecting and classifying "loser fish" in Atlantic salmon aquaculture. The authors compared YoloV5, YoloV7, and a two-stage approach, with YoloV7 showing the best performance. Results were validated against human classifications, showing promising accuracy. Despite challenges like varying light conditions and fish positions, these automated methods offered efficient alternatives to manual monitoring.
Future work should focus on improving these systems and diversifying training datasets. Implementing such methods in fish farms can enhance welfare monitoring and help identify the causes of loser fish syndrome.
Journal reference:
- Banno, K., Gonçalves, F. M. F., Sauphar, C., Anichini, M., Hazelaar, A., Sperre, L. H., Stolz, C., Aas, G. H., Gansel, L. C., & da Silva Torres, R. (2024). Identifying losers: Automatic identification of growth-stunted salmon in aquaculture using computer vision. Machine Learning with Applications, 100562. https://doi.org/10.1016/j.mlwa.2024.100562, https://www.sciencedirect.com/science/article/pii/S2666827024000380
 AI Offers Hope For Coral Reefs: Machine Learning Predicts Resilience Amid Climate Change