In a paper published in the journal Infrastructures, researchers presented an automated method for recommending sublayer and form layer thicknesses in railway tracks using the cone penetration test (CPT) data. This approach leveraged machine learning (ML) algorithms to classify soil types and optimize trackbed design.
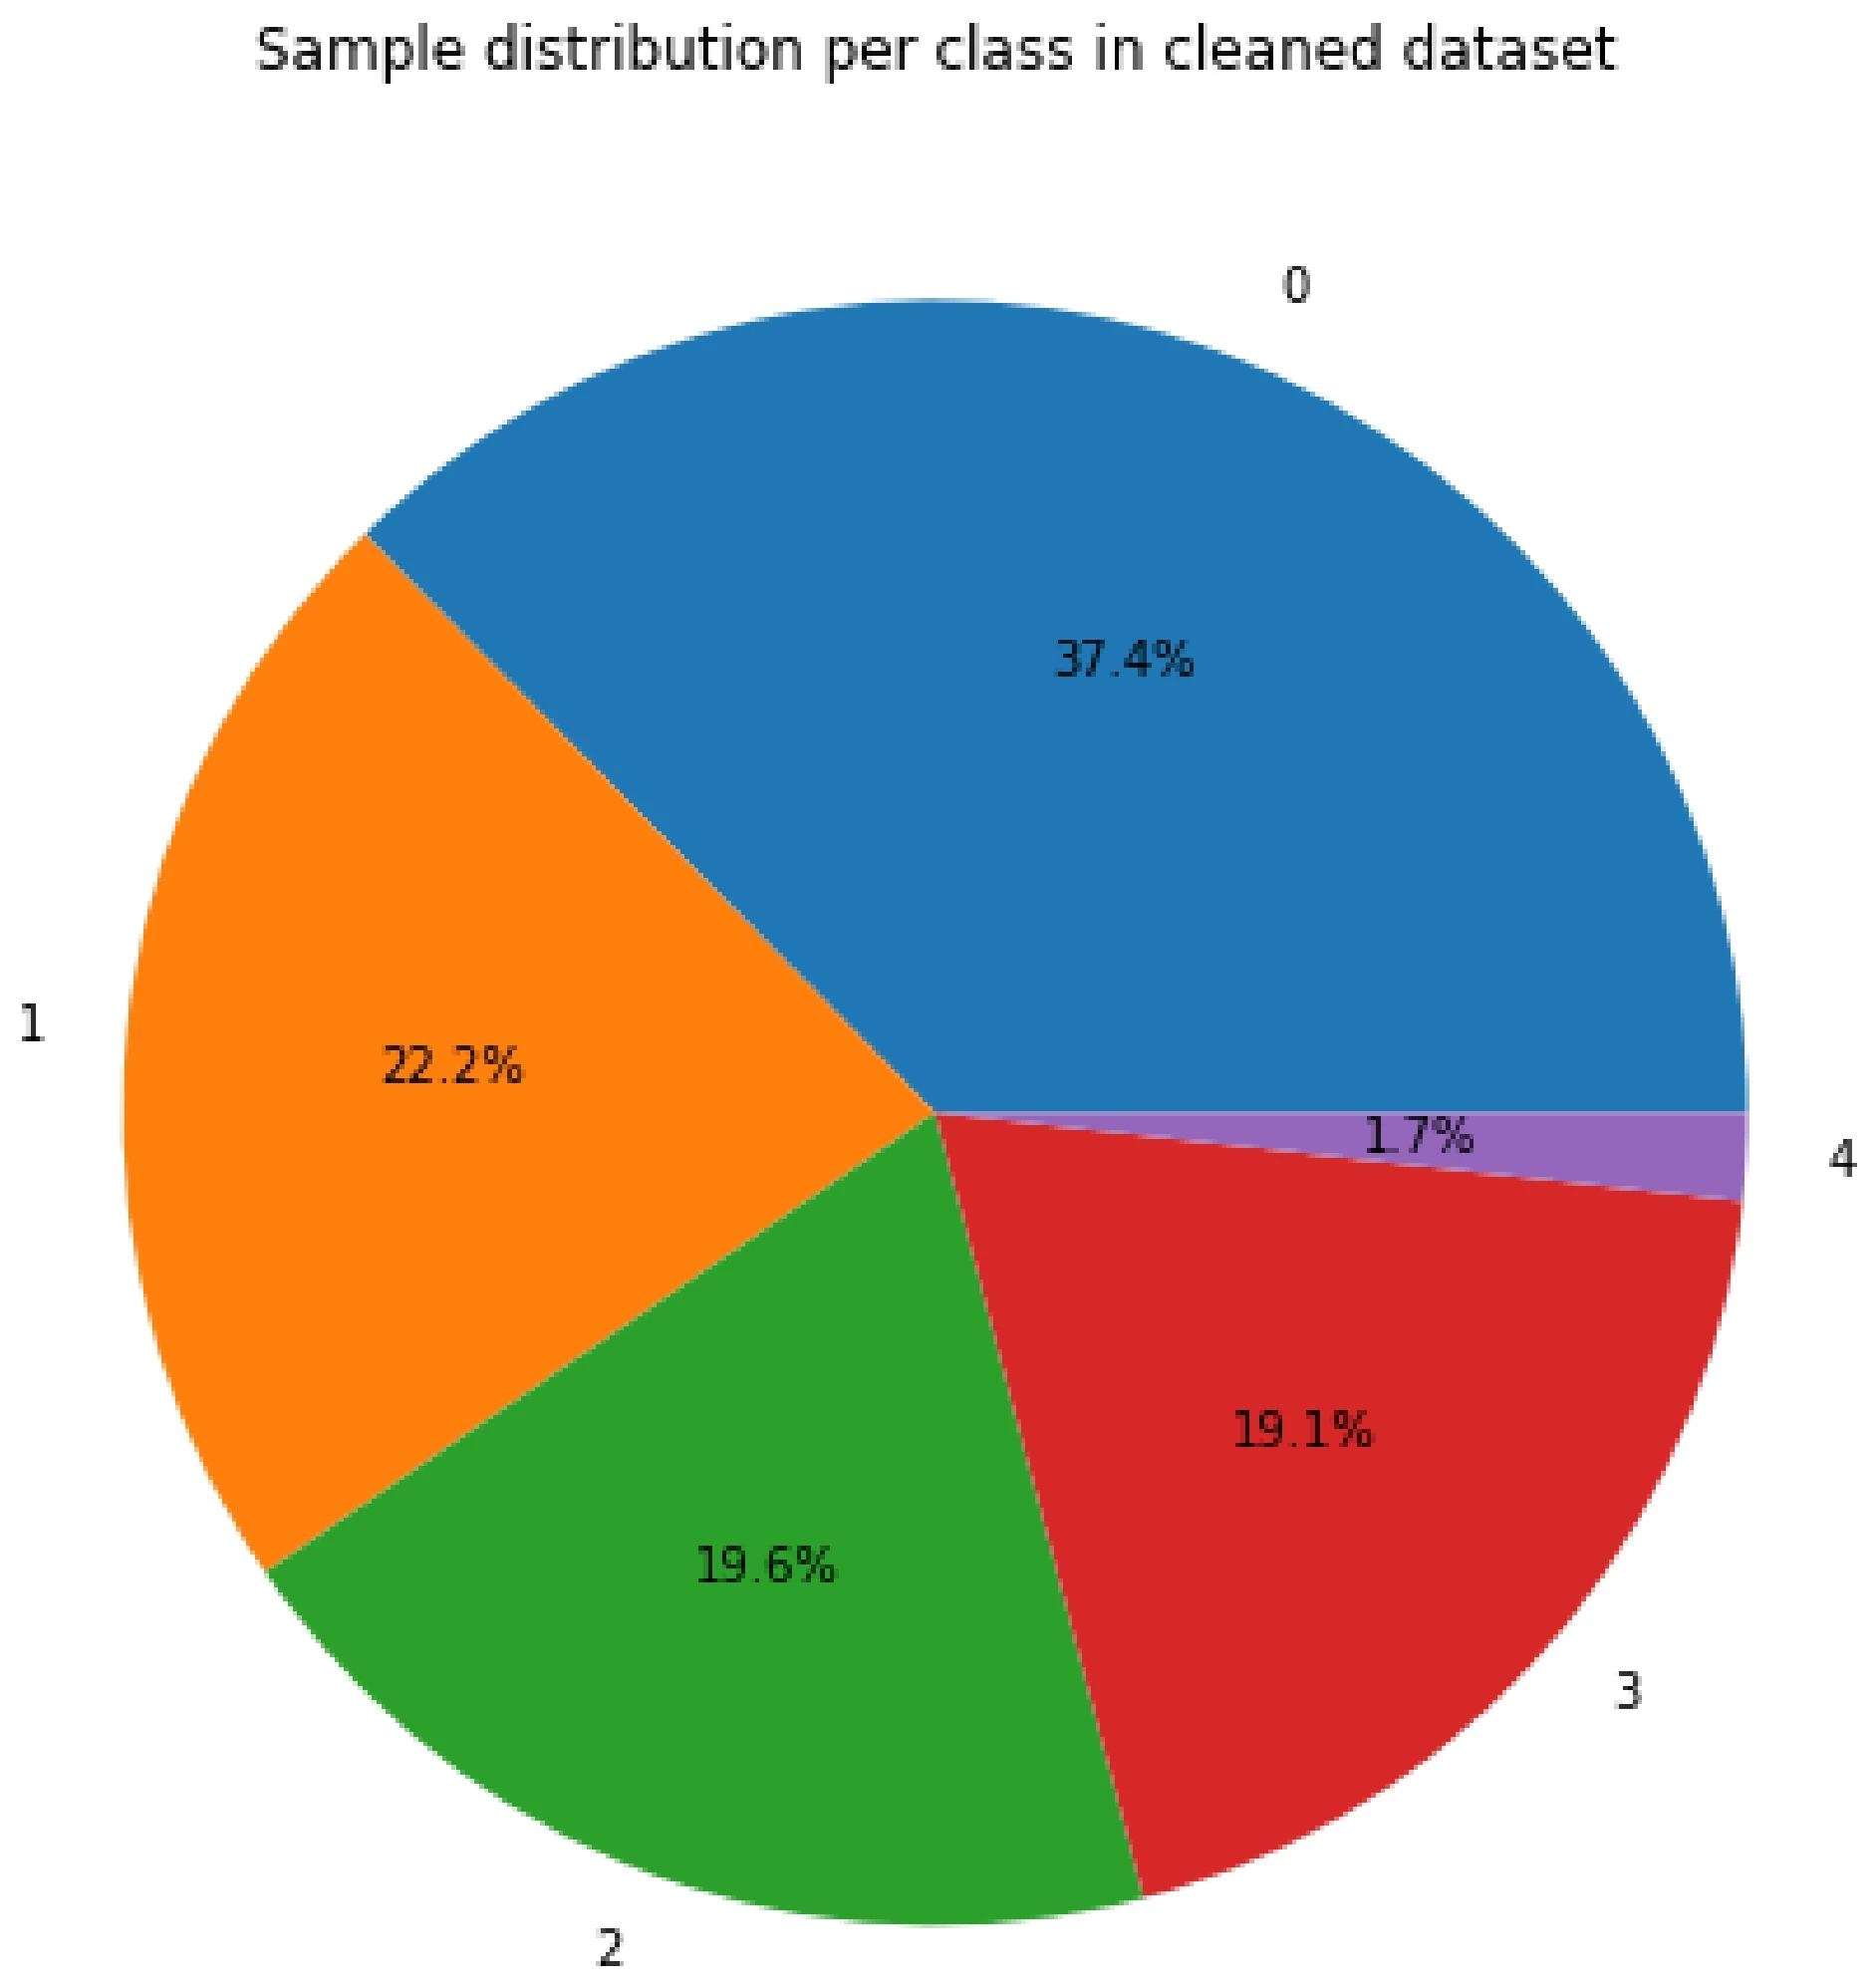
 Imbalanced train dataset: the classes from Table 3 are not represented by the same number of samples (ranging from 37.4% of the total dataset for class 0 to 1.7% for class 4). Image Credit: https://www.mdpi.com/2412-3811/9/8/121
Tested with CPT data from the Belgian railway network, the method achieved high accuracy using a random forest (RF) classifier and was fine-tuned with Bayesian optimization. The results closely matched traditional soil investigation interpretations, demonstrating the model's effectiveness in designing sub-ballast layers and improving track infrastructure.
Related Work
Past work has highlighted the critical role of geotechnics in railway infrastructure, focusing on optimizing sublayers to enhance stability and performance. ML models have shown promise in soil classification using CPT data but often rely on individual soundings rather than comprehensive site-wide analyses. Recent advancements propose integrating ML with CPT data for a more holistic approach to soil reinforcement.
Data Collection and Analysis
The team gathered data for this study using the penetration test to assess railway subgrade (PANDA) stability. This method measures dynamic cone resistance at various depths to evaluate the strength of railway subgrades and platforms. The PANDA test involves driving steel rods with a conical tip into the ground and recording the resistance, which is then presented as pentagrams illustrating resistance variation with depth. To ensure accurate measurements, the team performed a preliminary excavation to reduce lateral friction interference, allowing the analysis to focus solely on cone resistance.
The dataset includes 2,500 PANDA soundings from 560 different sites. Average cone resistance values were calculated for various depths at each site to guide recommendations for sublayer and form layer thicknesses during site renewals. The team organized the data into two databases: one for features, detailing average cone resistance values, and one for labels, indicating the thicknesses of the sub-ballast and form layers. Outliers were identified and removed using z-scores to ensure data quality,
For ML purposes, the dataset underwent several pre-processing steps. Zero padding was applied to ensure uniform input sizes across samples, while scaling was performed using the RobustScaler to standardize the data and mitigate the impact of outliers. Researchers used stratified sampling to maintain class distribution, and SMOTE was employed to address class imbalance by creating synthetic samples for underrepresented classes.
The analysts selected an RF classifier for its proven effectiveness in similar tasks. Bayesian search, combined with 5-fold cross-validation, was used to optimize the model's hyperparameters. By precisely adjusting the model's hyperparameters, this method decreased the likelihood of overfitting while enhancing the model's performance and generalization.
After being trained on the pre-processed data and cross-validated, the finished model was evaluated on untested data. Precision and recall were balanced using the F1 score as the main criteria to ensure a thorough assessment of the model's efficacy. Researchers assessed the performance using a classification report and confusion matrix, which provided detailed insights into the model's accuracy and ability to manage class imbalances.
Model Performance Summary
The RF classifier achieved an F1 score of 87% during cross-validation with hyperparameters. In the test set, the model yielded an accuracy of 83%. The confusion matrix illustrates the model's precision, revealing that the highest prediction rates are for classes 0 and 4, which are extreme cases with fewer neighboring classes. The model effectively distinguishes between these more distinct categories.
Classes 1, 2, and 3, which are closer and more intertwined, posed greater challenges for differentiation. The difficulty in differentiating these classes is reflected in the model's performance, with a minimum of 71% accuracy for class 2.
Despite these challenges, the model's performance remains acceptable, demonstrating robustness in handling various soil layer thicknesses. The classification report summarizes key metrics for the imbalanced dataset, including precision, recall, and F1 score. These metrics highlight the model's effectiveness in managing class imbalances and provide insights into its overall performance. The results confirm that the RF classifier is a reliable tool for predicting soil layer characteristics in railway infrastructure.
Conclusion
To sum up, this study utilized an RF classifier to enhance the design of subgrade thicknesses for railway tracks and individual assets by analyzing CPT data. The model effectively integrated multiple soundings and was optimized through Bayesian tuning and cross-validation, achieving an 83% overall test accuracy rate. It demonstrated the model's capability to provide valuable recommendations for subgrade thickness based on historical data.
The results indicated that the approach could serve as a useful tool to assist railway asset management in making decisions, with a methodology that includes hyperparameter optimization, resampling, and data cleaning. Future research could expand on this work by incorporating additional features, such as traffic speed and environmental conditions, and exploring other testing methods like geoendoscope tests, potentially utilizing neural networks for more comprehensive diagnostics of railway tracks.
Journal reference:
- Bernard, M. (2024). Integrating Machine Learning in Geotechnical Engineering: A Novel Approach for Railway Track Layer Design Based on Cone Penetration Test Data. Infrastructures, 9:8, 121. DOI: 10.3390/infrastructures9080121, https://www.mdpi.com/2412-3811/9/8/121