In a paper published in the journal Scientific Reports, researchers employed convolutional neural networks (CNNs) and hierarchical clustering to classify Flickr images captured within protected areas (PAs). A study of 87,090 photos from 2,813 PAs in 207 countries revealed three main types of cultural ecosystem services (CES) activities: human-nature (abiotic), human-nature (biotic), and human-human.
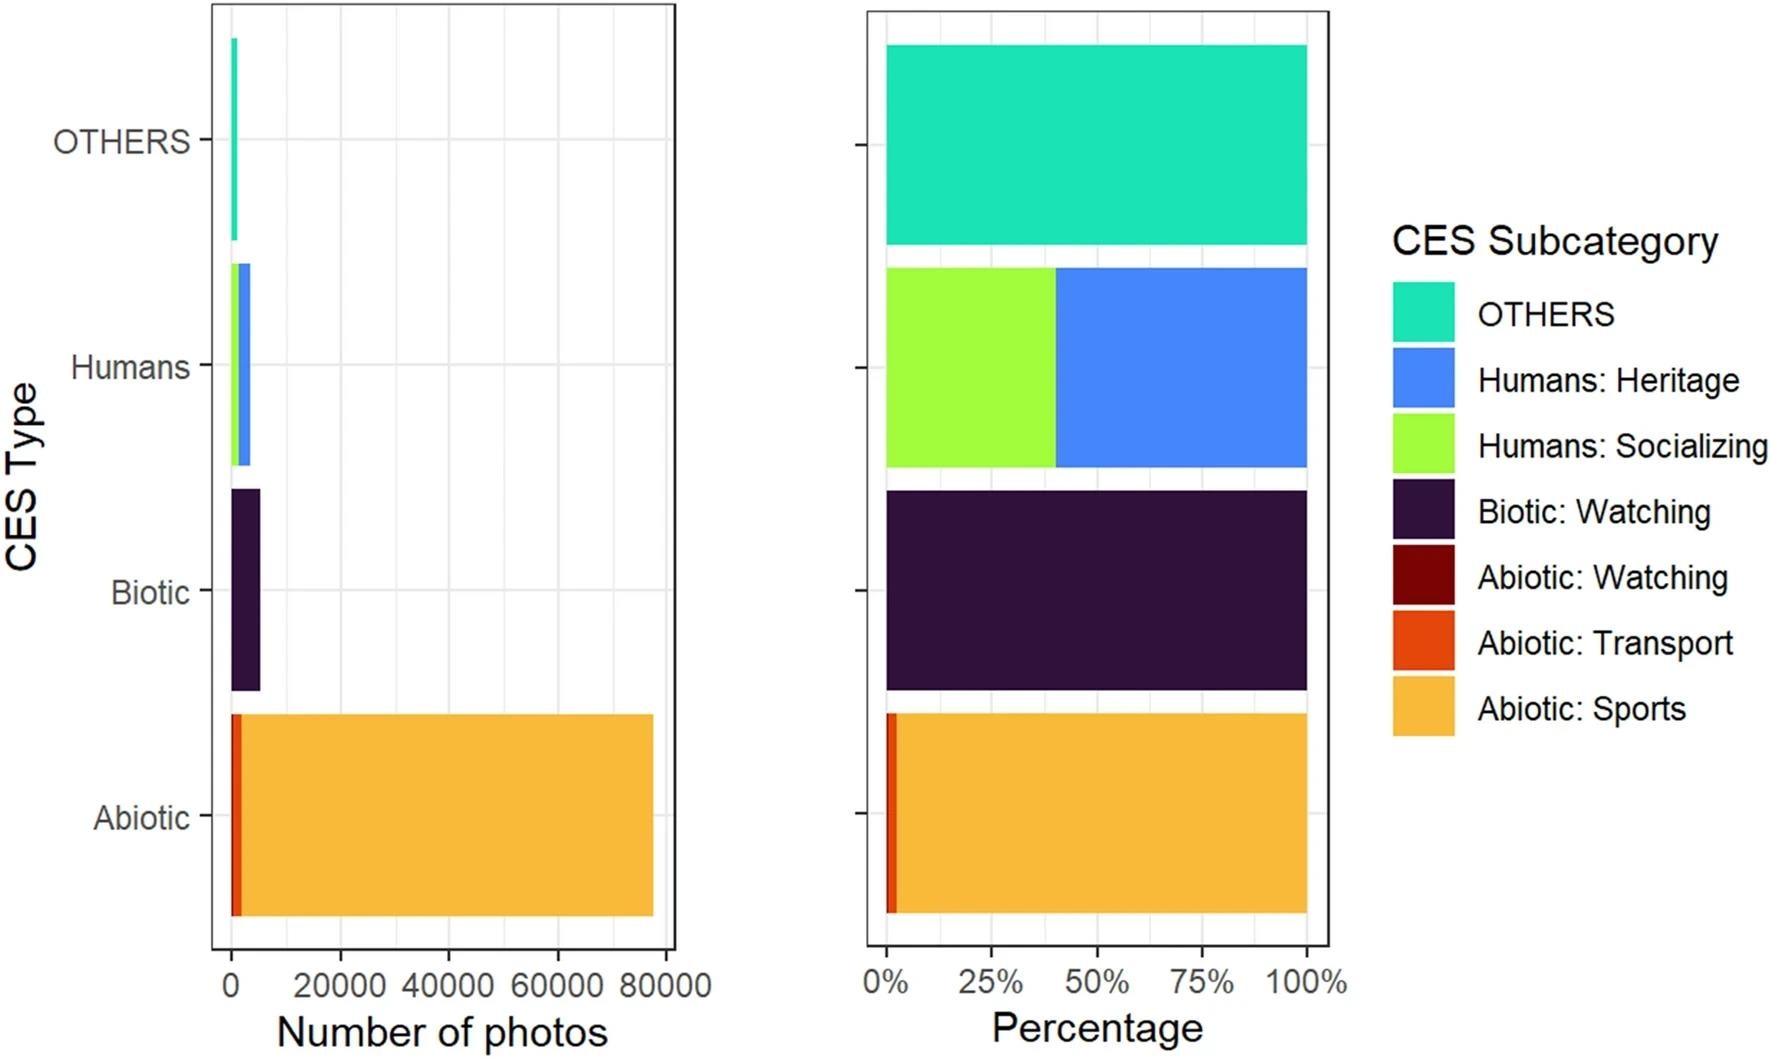
 Number of photos (left) and percentage (right) for each CES category and subcategory in the final sample of photos. Image Credit: https://www.nature.com/articles/s41598-024-64115-3
Abiotic interactions controlled mountain ranges, biotic interactions characterized equatorial regions, and human-human interactions were predominantly present in Europe. Mixed-effects models indicate that the biome has little impact on each nation's CES types of PAs. They show that CES operations are mostly determined by management at the national level. The findings show that social media data is valuable for interpreting visitor behavior in PAs.
Background
Previous studies highlighted the function of PAs in biodiversity conservation and the importance of finding new funding sources due to growing expenditures, such as nature-based tourism. However, more tourists mean an increased risk of ecological harm; thus, sustainable management is essential. While it can be complicated to understand CES, scalable solutions are available due to social media and machine learning (ML).
Ecosystem Services Analysis
The study began by compiling a comprehensive dataset of PAs worldwide using the World Database on PAs. There are 246,483 PAs because legal designation, the existence of a polygon, and terrestrial classification were requirements for inclusion. The team used these PAs as bounding boxes to extract photographs from Flickr that matched certain requirements, including geotagging within PAs, temporal restrictions (2010–2021), and usage rights (public domain or creative commons). This method produced 824,508 images from 207 nations; however, sampling was necessary due to computational constraints. Hence, the final output was reduced to 107,750 images.
After extracting photos, the analysts removed metadata and descriptions from the photographs and then used Microsoft's Azure computer vision application to tag the images. They obtained 5,127 recognized tags from 87,090 pictures by keeping tags with a minimum of 0.5 confidence scores. The photographs were then divided into 102 clusters using agglomerative clustering after these tags were utilized to create a sparse matrix for hierarchical classification using Jaccard distance. After more manual merging, there were just 102 clusters left, each labeled according to the most common behaviors shown in the images.
When the team studied definitions from the common international classification of ecosystem services (CICES), it was determined that this was not sufficient to classify these activities into CES; however, the study proposed its own CES categories—biotic, abiotic (including sports), and human (including heritage and socializing)—to encapsulate better observed human-nature interactions. These categories were adapted to reflect relational values between humans and nature, which were not fully addressed in frameworks like CICES.
Subsequently, connections between CES categories and biome types were examined using generalized mixed-effects models. These models examined whether biome type affected the probability of photographs falling into particular CES categories (abiotic, biotic, humans), and they were trained at the individual photo level. Random intercepts have been implemented for PAs nested within countries to account for differing country-level effects. These analyses aimed to explain how ecological environments affect cultural ecosystem services seen throughout the world's PAs.
Global CES Distribution
Based on an extensive examination of global PAs, the study results show clear trends in the distribution and classification of CES. The predominant CES type identified from the photo dataset was abiotic, encompassing 89.1% of the total, with sports activities constituting the majority (97.6%) within this category. Transport and watching activities contributed 2.11% and 0.33% to the abiotic CES photos. Biotic CES photos accounted for 6.00% of the dataset, while human CES photos comprised 3.74%, predominantly categorized into heritage (59.7%) and socializing (40.2%) subcategories, with a small percentage categorized as "others" (1.21%).
Geographically, the distribution of CES photos exhibited notable trends across different continents and biomes. Abiotic CES images highlighted in mountainous terrain and natural ecosystems were widely exhibited globally across temperate and polar regions. The equatorial belt is responsible for most biotic CES images, particularly in PAs with high endemism and species richness, such as those bordering the Amazon rainforest in Ecuador and Indonesia. Most human CES images were discovered in European countries, often in nearby national parks that include important historical buildings or man-made cultural landmarks.
The study analyzed the association between the classifications of PAs by the International Union for Conservation of Nature (IUCN) and the categories of CES. A smaller number of images were taken in category Ia (strict nature reserve) and Ib (wilderness area), with most of them taken in category II PAs (national parks). The CES distribution varied significantly both within and between nations. It was illustrated by the different CES types found in nearby PAs, such as the Moremi game reserve in Botswana and the Kruger National Park in South Africa. These results highlight the complex interplay among human activity, environmental context, and ecosystem service classification within global PAs.
Conclusion
To sum up, the study investigated CES across worldwide PAs using CNNs and hierarchical clustering analysis on Flickr photographs. It indicated clear patterns: human-human relationships were common in Europe, biotic interactions in equatorial regions, and abiotic interactions in the highlands.
Mixed-effects models showed that CES distributions in PAs were significantly impacted by country-level attributes as opposed to biome types. This approach demonstrates how useful social media data is for comprehending visitor behavior and influencing conservation and management plans for PAs across the globe.
Journal reference:
- Yee, T. B. L., & Carrasco, L. R. (2024). Applying deep learning on social media to investigate cultural ecosystem services in protected areas worldwide. Scientific Reports, 14:1, 13700. DOI: 10.1038/s41598-024-64115-3. https://www.nature.com/articles/s41598-024-64115-3