Results indicated strong performance with support vector regression (SVR). Soybean varieties were classified into drought injury scores (DIS), achieving a higher accuracy at maturity. This method offers a rapid, high-throughput approach for assessing soybean drought tolerance, with potential applications in other crops.
Previous studies have shown that drought significantly reduces plant growth and yield, causing annual grain losses in China. Soybeans are particularly affected by their vulnerable root systems, making traditional, subjective breeding methods insufficient. Advances in UAV-based aerial phenotyping offer a solution by enabling non-destructive, cost-effective, and high-throughput analysis of crop traits.
Despite their effectiveness in capturing stress responses, most UAV drought research focuses on visual evaluations at maturity, leading to idealized results. Drought tolerance indices (DTIs) based on yield offer a more accurate assessment. However, their relationship with UAV traits in soybeans still needs to be explored, and multi-stage evaluations still need to be completed.
Experimental Setup and Methodology
The experiment was conducted at the Yazhou and Jiyang trial sites in Sanya City, Hainan Province, China, using uniform soil throughout the fields. In the winters of 2021 and 2022, 215 and 510 soybean varieties were sown in Jiyang and Yazhou, respectively. Due to force majeure, data from 427 and 509 soybean varieties were retained. Each field had four blocks with two replicates for well-watered (WW) and drought-stressed (DS) conditions.
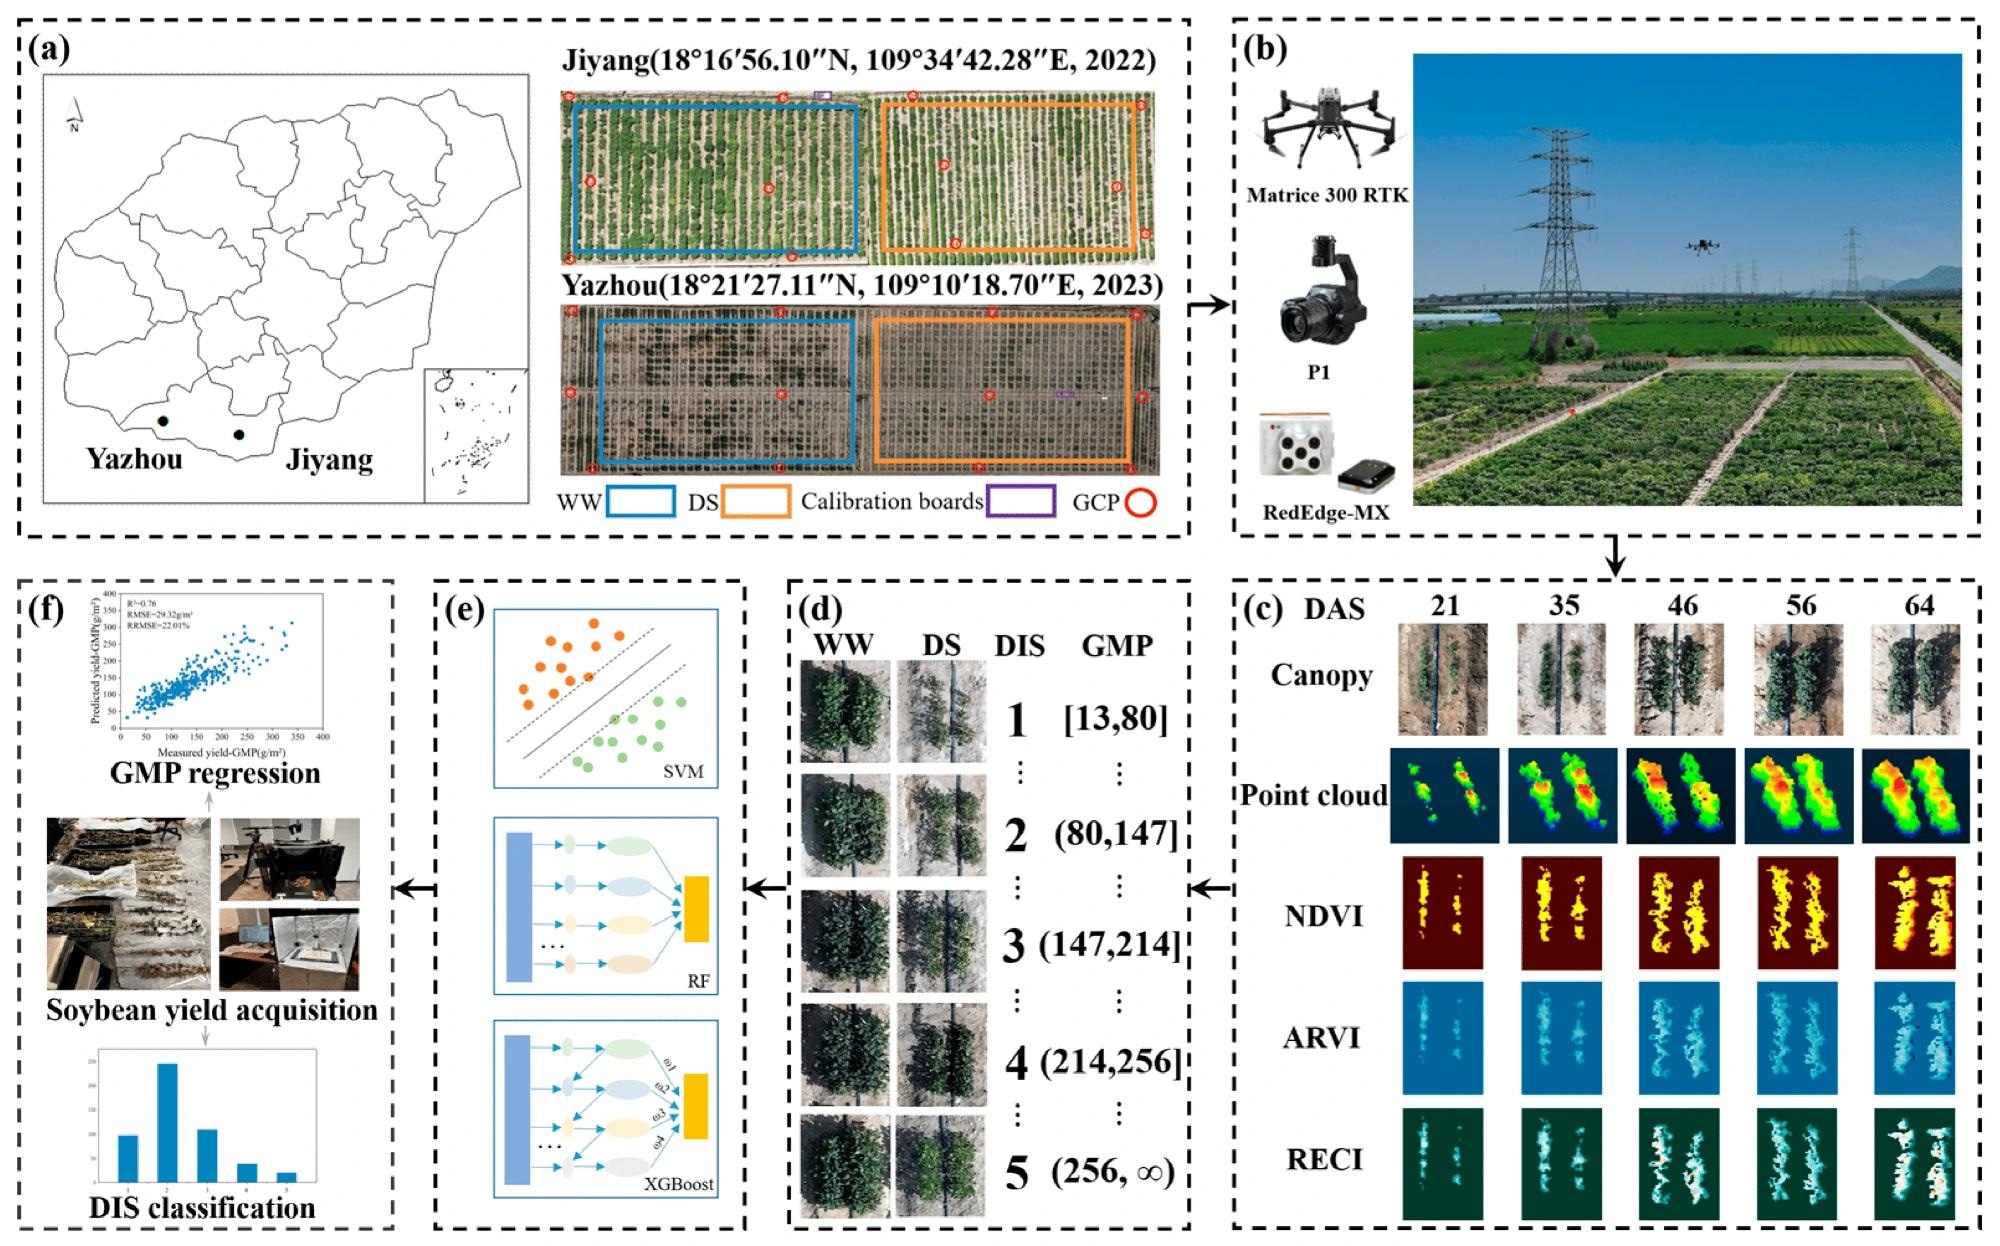 Experimental study design and workflow. (a) Location of the experimental site. (b) DJI Matrice 300 RTK UAV platform equipped with visible and multispectral sensors for soybean image acquisition. (c) Multimodal data for soybeans over multiple fertility stages. (d) WW and DS soybean plots and DISs. (e) Machine learning modeling. (f) GMP regression and DIS classification for multiple fertility stages.
In 2021, planting was done in double rows with 10 cm plant spacing and 60 cm ridge spacing, and in 2022, with 15 cm plant spacing and 80 cm ridge spacing. Each cultivar was sown using 16 seedlings.
The team irrigated well-watered (WW) blocks to maintain soil moisture at 85 ± 5% of field capacity, while the drought stress (DS) blocks received no irrigation post-emergence. Between 75 and 105 days after sowing (DAS), the team conducted harvesting and determined yields using a digital seed examiner for three consecutive plants per variety.
A Da-Jiang innovations (DJI) matrice 300 RTK UAV with visible (P1, DJI) and multispectral (Rededge-MX; MicaSense) sensors were used to collect remote sensing images. The UAV flew at an altitude of 30 meters with a speed of 1 m/s, capturing images at one frame per second with high overlap rates.
Calibration was performed using reflector plates and 12 ground control points (GCPs). The analysts acquired UAV data for Jiyang at 71 DAS, while they collected data for Yazhou at five stages (21, 35, 46, 56, and 64 DAS) to ensure comprehensive coverage. Data collection was done between 11:00 and 14:00 under optimal weather conditions. Images from the UAV were processed using Agisoft photoscan to generate dense point clouds and orthophotos. Red, green, and blue (RGB) orthophotos were used to extract canopy traits like coverage, length, and width, utilizing the excess green (Exg) index for segmentation.
The random sample consensus (RANSAC) algorithm determined plant height and canopy volume from 3D point-cloud models. Multispectral images provided vegetation indices such as normalized difference vegetation index (NDVI), atmospherically resistant vegetation index (ARVI), and red-edge chlorophyll index (RECI), calculated from reflectance values. These indices are effective indicators of crop drought stress.
Canopy traits under WW and DS conditions were correlated with yield, and their dynamics were evaluated at different growth stages. ML models, including extreme gradient boosting (XGBoost), random forest (RF), and support vector machine (SVM), were employed to estimate drought tolerance indices (DTIs) and drought injury scores (DIS).
Researchers used data from Yazhou 64 DAS to train and test the models, with migration to Jiyang data to assess generalization. The model's performance was evaluated using R², root mean square error (RMSE), and relative RMSE (RRMSE).
Soybean Canopy Trait Analysis
The results and discussion section delves into the comprehensive analysis of soybean canopy traits under contrasting water regimes (WW and DS) at Yazhou and Jiyang trial sites in Sanya City, China. Significant differences in canopy coverage, plant height, length, width, volume, and vegetation indices (NDVI, ARVI, RECI) were observed at maturity between WW and DS conditions, quantified using mean absolute percentage error (MAPE).
Dynamic changes in these traits across fertility stages highlighted their role in evaluating soybean drought tolerance. ML models (XGBoost, RF, SVM) accurately predicted drought tolerance indices and assessed soybean performance under different conditions.
Conclusion
To summarize, this study utilized UAV data and machine-learning models to evaluate soybean drought tolerance across growth stages at Jiyang (N = 427) and Yazhou (N = 509) sites under WW and DS conditions. Canopy traits at maturity showed correlations with yield, with biomass traits peaking at maturity (64DAS) under WW and at podding (46DAS) under DS, while vegetation indices increased gradually in both conditions.
GMP effectively assessed drought tolerance, with XGBoost achieving high accuracy in DIS classification based on GMP. Future research will explore genetic factors influencing soybean drought tolerance and expand UAV applications to diverse crop stress scenarios.
Journal reference:
- Liang, H., et al. (2024). Evaluation of Soybean Drought Tolerance Using Multimodal Data from an Unmanned Aerial Vehicle and Machine Learning. Remote Sensing, 16:11, 2043. https://doi.org/10.3390/rs16112043, https://www.mdpi.com/2072-4292/16/11/2043
 Robotic Coaches Aim To Revolutionize Physical Therapy By Accelerating Motor Skill Recovery